


Burndown Chart | Download Burndown Chart Excel
What is Burndown Chart?
Almost all projects have deadlines and limited resources, and a burndown chart is a simple graphical method of presenting the work vs. the time left in a project while taking into account the resource availability.

The most common layout of the chart is to present the work left (in work hours) along the vertical (Y) axis, and the time left (in work days) in the horizontal (X) axis.
The first burndown charts were used as a management tool in projects which
used the agile methodology, but have since expanded to any projects which need to present the progress over time.
What does Basic Burndown Chart Contains?
The basic burndown chart contains two lines –
Baseline:
The line starts at day zero of the project, somewhere on axis Y. It represents the amount of work left to complete, and the number of days in which to complete it
Actual:
The line starts with the baseline, and is updated periodically with the actual amount of work completed Both these lines appear in the same chart, and if the actual is above the baseline this means that the project is behind
schedule. If the actual is below the baseline then the project is ahead of schedule.
Sprint Burn down Chart
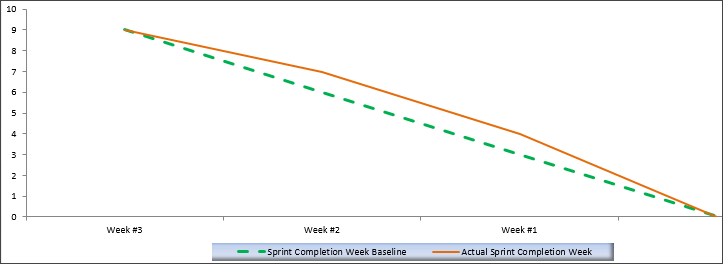

The original use of the burndown chart was to represent the number of sprints (or stories) which were left is a project which was managed using agile methodology. The Y axis represented the effort required to complete the project (in sprints / stories),
and the X axis the time left.
Usually these charts were between two and four weeks, and each one represented a single sprint. The Sprint Master usually updates the actual line at the end of each daily stand-up meeting, and the baseline
at the start of the project.
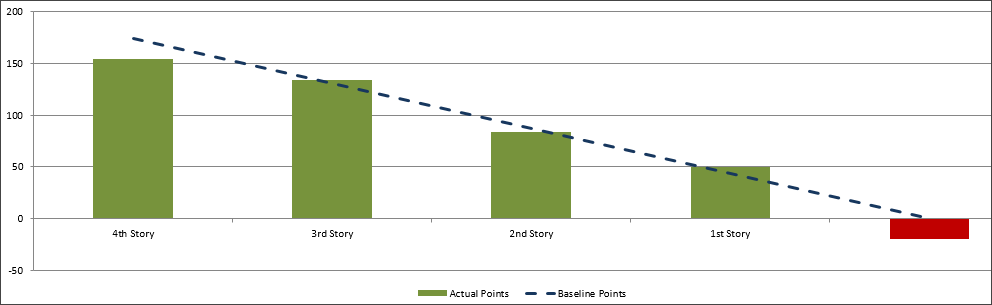
Release Burndown Chart


This type of chart is also used in the agile project management methodology, but differs slightly from the Sprint burndown chart.
This type of chart is used to track progress of a project focused on a release during its lifecycle. In the
release chart the Y axis represents the number of aggregate points in all of the remaining sprints, and the X axis represents the number of sprints in the release.
Unlike other burndown charts, this one usually presents the planned amount
of points per sprints with a line, and the actual points completed in each sprint with bars. Of course the classic two line style can be used as well.
Velocity Chart


An additional line sometimes used in a burndown chart is called a velocity line. This line represents the total effort a team is capable of in one given sprint, and is presented in points.
The velocity line is used in a burndown chart, to
be used to help the team evaluate the effort put into each sprint. The line is calculated while using the points earned in each sprint, and is then used to help plan for future sprints which involve the same level of innovation and resources.
Product Burndown Chart

The product burndown chart is used to manage the features and functional requirements of a product, which are described as user points. These are represented in a bar chart (unlike the usual line burndown chart), where the Y axis is the number of points left for completing the product, and the X axis represents the number of sprints / stories in the products’ lifecycle. It is simple to add / remove functionality or features in the bars, represented as points.
Iteration Burndown Chart
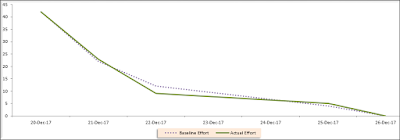

This type of chart is used to manage projects which have various iterations in their lifecycle, and they are managed using an agile methodology. Like most burndown charts this one also represents the effort required in its Y axis and time available in
its X axis.
Each one of the iterations is represented in a separate chart, and contains the effort in work hours required for each story / sprint in the columns.